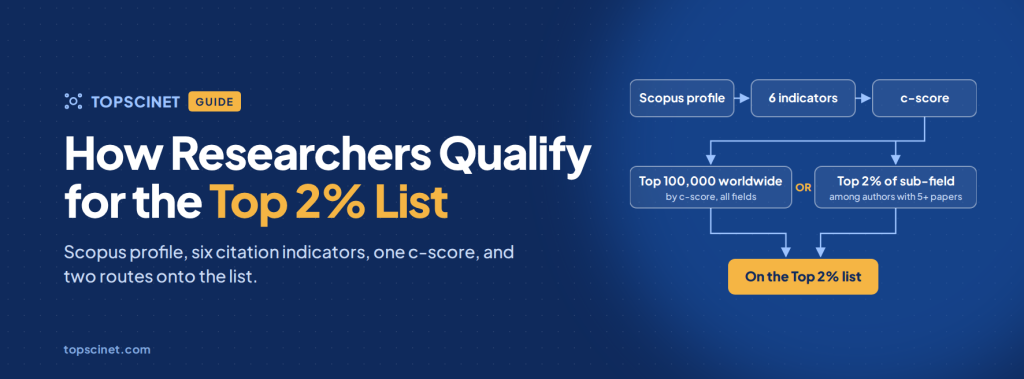

Nobody applies to the Top 2% list, and nobody is nominated. Every researcher with a Scopus author profile is scored automatically on six citation indicators, and those scores decide who is included. This guide explains each step, using the dataset’s own published methodology.
The list is widely known as the “Stanford Top 2% Scientists” or “World’s Top 2% Scientists” list. Its formal name is Updated science-wide author databases of standardized citation indicators. A new version is released each year, usually between August and October.
Who produces the list?
The database is built by John P.A. Ioannidis of Stanford University, using Scopus data from Elsevier. The method was first published in PLOS Biology in 2019, with an updated version in 2020, and the data has been refreshed every year since.
The data files are free to download from the Elsevier Data Repository (DOI 10.17632/btchxktzyw), and are mirrored on Stanford’s data repository. They are published under a CC BY-NC 3.0 licence.
The latest release, the August 2025 data update, uses a Scopus snapshot taken on 1 August 2025. Its career-long data runs to the end of 2024, and its single-year data covers citations received during calendar year 2024.
How a researcher qualifies, step by step
Step 1: The Scopus author profile
Everything starts from Scopus, Elsevier’s abstract and citation database. Scopus groups a researcher’s papers into an author profile automatically. The list uses those profiles as they are, so a split or merged profile changes the result (see “How to check and fix your profile” below).
Step 2: Six citation indicators
Each researcher is measured on six indicators:
- NC: total citations received.
- H: the h-index.
- Hm: the Schreiber hm-index, an h-index adjusted for co-authorship.
- NCS: citations to papers where the researcher is the single author.
- NCSF: citations to papers where the researcher is the single or first author.
- NCSFL: citations to papers where the researcher is the single, first or last author.
The last three reward the author positions that usually signal leading or senior roles on a paper. So the method favours impact from work a researcher led, rather than sheer paper count.
Step 3: The composite c-score
The six indicators are combined into one number, the composite citation score or c-score. Each indicator is log-transformed and divided by the highest value of that indicator in the whole database, and the six results are added together:
xi is the researcher’s value for indicator i, and max xi is the highest value of that indicator in the whole database.
The logarithm stops one very large number, such as a single paper with enormous citations, from dominating the score. The c-score is calculated twice, with and without self-citations.
Step 4: Fields and sub-fields
Every researcher is assigned to one of 22 fields and 174 sub-fields, using the Science-Metrix journal classification. A researcher’s main sub-field is the one where most of their papers fall. Percentile ranks within a field or sub-field are only calculated for researchers with at least 5 papers.
Step 5: The two routes into the list
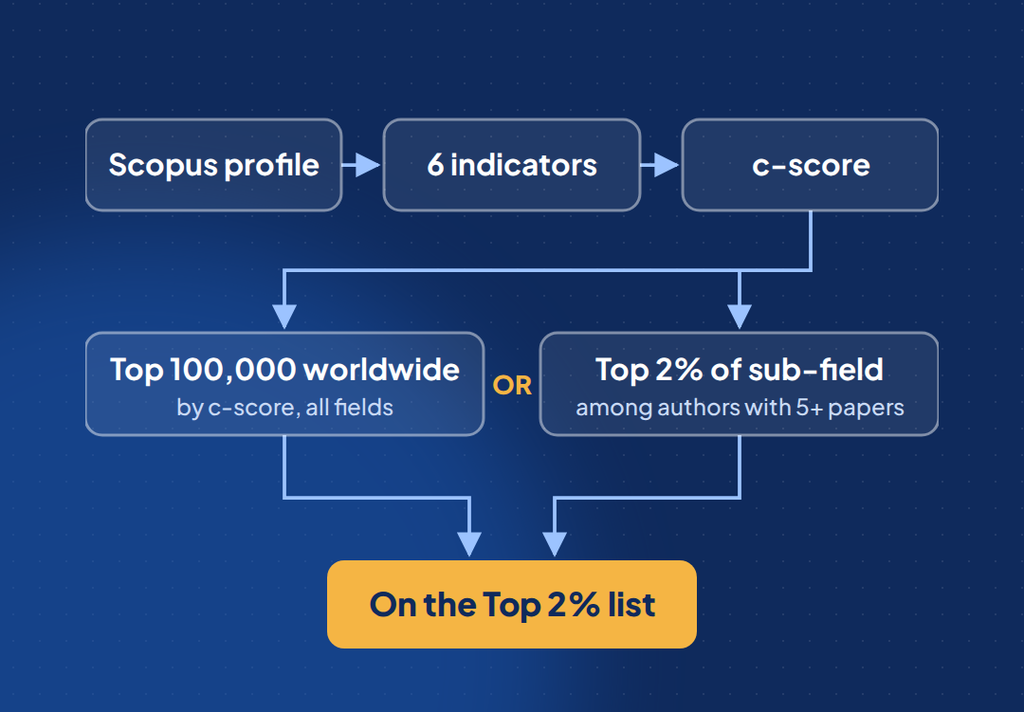
The dataset’s own definition is: “The selection is based on the top 100,000 scientists by c-score (with and without self-citations) or a percentile rank of 2% or above in the sub-field.”
- Route A, top 100,000 worldwide. Researchers ranked in the top 100,000 by c-score across all fields are included.
- Route B, top 2% of the sub-field. Researchers at the 2nd percentile or better within their main sub-field are included, even if they are outside the global top 100,000.
Route B is what makes the list fair across disciplines. Citation habits differ hugely between fields, so a strong mathematician can qualify through their sub-field without competing on raw numbers against, say, a biomedical researcher.
This also explains the name. “Top 2%” means top 2% within a sub-field, not the top 2% of all scientists in the world.
Two lists: career-long and single-year
Each annual release contains two separate lists. The same selection rules apply to both, and many researchers appear in both.
| Career-long list | Single-year list | |
|---|---|---|
| What is counted | Citations across a researcher’s whole career, up to the end of the latest full year | Citations received during one calendar year only (2024 in the August 2025 release) |
| Who it favours | Senior researchers with long, sustained impact | Researchers with strong current impact, including early- and mid-career researchers |
| How to describe it | “Top 2% scientist, career-long impact” | “Top 2% scientist, single-year impact (2024)” |
Self-citations
Every indicator and the c-score are published twice: with self-citations and without them. The dataset also reports the share of each researcher’s citations that are self-citations, and a ratio of citations to citing papers.
These extra columns let readers spot unusual citation patterns, such as a very high self-citation share. The selection uses c-scores both with and without self-citations, and the published rank tables let you look at either version.
Common misconceptions
- “It is the top 2% of all scientists in the world.” Not exactly. It is the top 2% within each sub-field, plus the global top 100,000 by c-score.
- “You can apply or be nominated.” No. Inclusion is calculated from Scopus data only. There is no application, fee or committee.
- “It is an award from Stanford University.” No. It is a research dataset built by a Stanford professor. It is not an institutional award or an official university ranking.
- “It measures the quality of research.” It measures citation impact. The authors stress that citation metrics need careful interpretation and are most meaningful when compared within the same sub-field.
- “Being left off means low impact.” Not necessarily. Profile errors, citations missing from Scopus, or a sub-field assignment that does not match your work can all keep a strong researcher off the list.
- “The list is the same every year.” No. It is recalculated each year from fresh Scopus data, so researchers can enter or drop off between releases.
How to check and fix your profile
- Search the latest list. Look yourself up by name on TOPSCINET, or download the official files from the Elsevier Data Repository. Check both the career-long and the single-year list.
- Check your Scopus author profile. Search your name on Scopus and look for duplicate profiles, missing papers, or papers by someone else with a similar name.
- Request corrections from Scopus. Use Scopus’s author feedback process to merge duplicate profiles or remove wrong papers. Corrections are made in Scopus, not in the Top 2% dataset.
- Wait for the next release. The dataset is archived once published and is not edited afterwards, so corrected profiles only show up in the next annual update.
If you are on the list, claim your profile on TOPSCINET to show a verified badge on your page.
Frequently asked questions
How is the Top 2% Scientists list calculated? Each researcher’s Scopus profile is scored on six citation indicators, which are combined into a composite c-score. Researchers qualify if they are in the top 100,000 worldwide by c-score, or in the top 2% of their main sub-field.
Can I apply to be included in the Top 2% list? No. Inclusion is automatic and based only on Scopus citation data.
What is a c-score? A composite citation score that adds together six log-normalised indicators: total citations, h-index, co-authorship-adjusted hm-index, and citations to papers as single, first, or last author.
What is the difference between the career-long and single-year lists? The career-long list counts citations over a whole career. The single-year list counts only citations received in one calendar year.
How many papers do I need? Sub-field percentiles are only calculated for researchers with at least 5 papers. In practice, reaching either threshold takes a substantial, well-cited body of work.
When is the list updated? Once a year, usually between August and October. The August 2025 update uses Scopus data frozen on 1 August 2025.
Why am I not on the list even though my citations are high? The most common reasons are a split Scopus profile, citations in sources Scopus does not index, or a very competitive sub-field. Check your Scopus profile first.
Searchable Database for Top 2% Scientists
Visit TOPSCINET.com
If your name appears in the search results, claim your profile using your institutional email to update your social media links and enhance your online presence.